For middle & high school math

Learn graphs by tracing them.

Students trace up to 15 graphs with a finger and watch the axis light up: domain, range, increasing and decreasing intervals, and where the graph is positive or negative. Then they practice and prove it in three modes.

No sign-in needed: try the Line graph in all three modes, plus a simulated class session.

Ready to run it with your class? Teachers: sign in with Google to start a real session free: one graph, up to 35 students, no card.

Already signed up? Log in at class.graphtracer.app and bookmark it.

Three modes

Trace the graph. Find the answer. Master the skill.

Every graph works in all three modes, so students move from seeing an idea to proving they know it without switching tools.

Explore

Trace the graph to explore domain, range, and more.

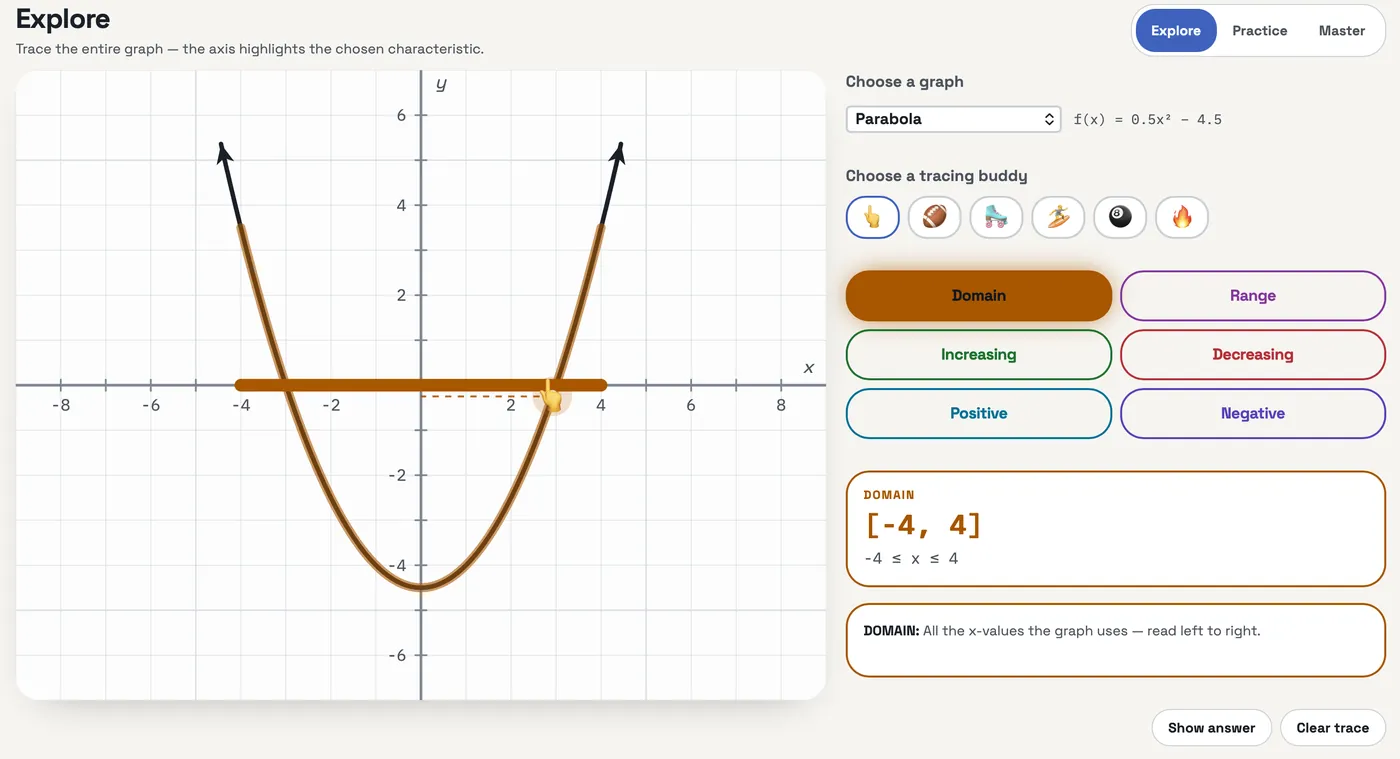
Students pick a graph and a tracing buddy, choose a characteristic, and trace the whole graph. The trace and the axis light up in that characteristic's color, and the interval builds as they go.

  • Interval notation and inequality side by side
  • Six characteristics, each with its own color
  • Tracing buddies: 👆 🏈 🛼 🏄 🎱 🔥
Explore mode: a parabola traced in orange with the domain from negative 4 to 4 highlighted on the x-axis and shown as the interval negative 4 to 4.

Practice

Highlight the interval you think is correct, then check.

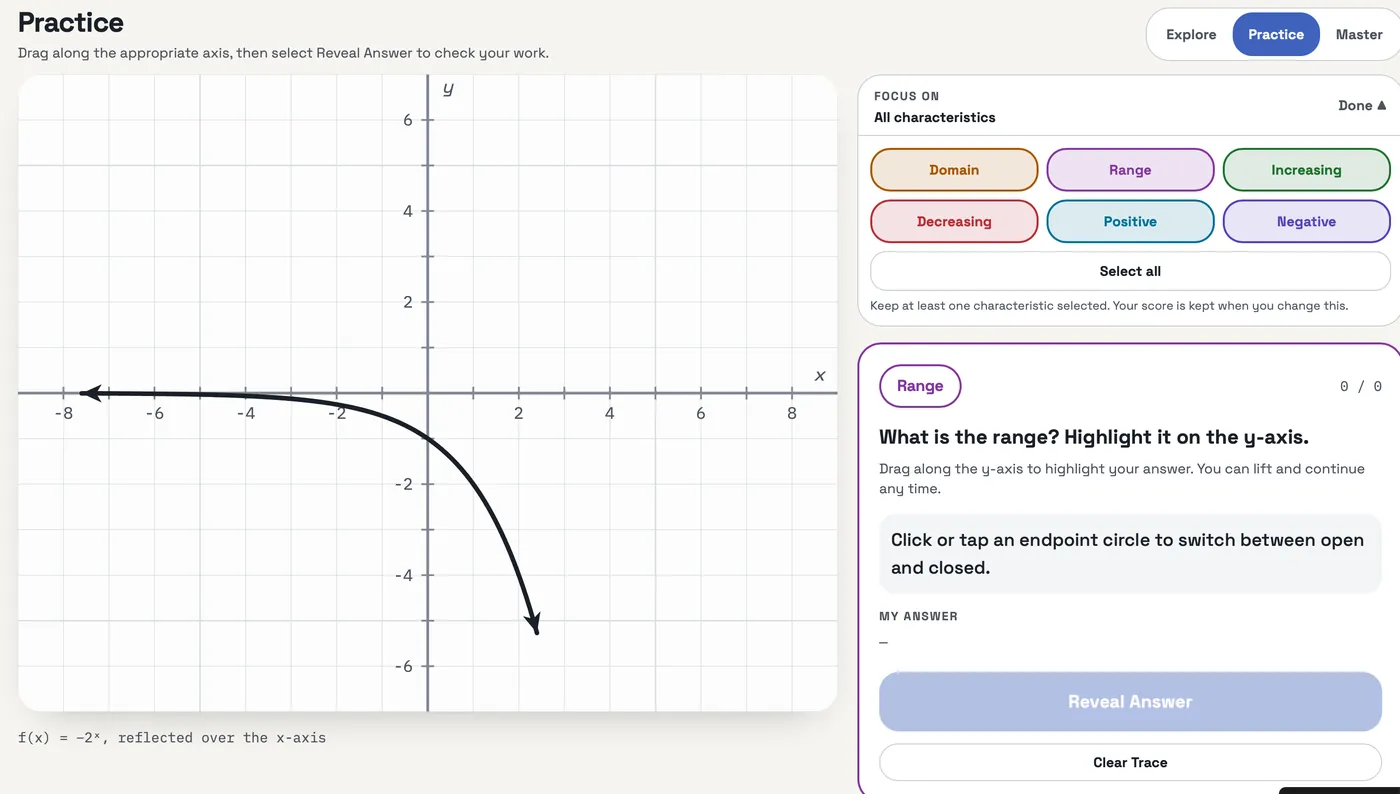
Students drag along the right axis to mark their answer and tap an endpoint to switch it between open and closed. Reveal Answer shows whether they got it.

  • Students build the interval themselves
  • Open and closed endpoints are part of the answer
  • Focus on one characteristic or mix all six
Practice mode: an exponential graph reflected over the x-axis with the prompt: What is the range? Highlight it on the y-axis.

Master

Test your knowledge by choosing the correct interval.

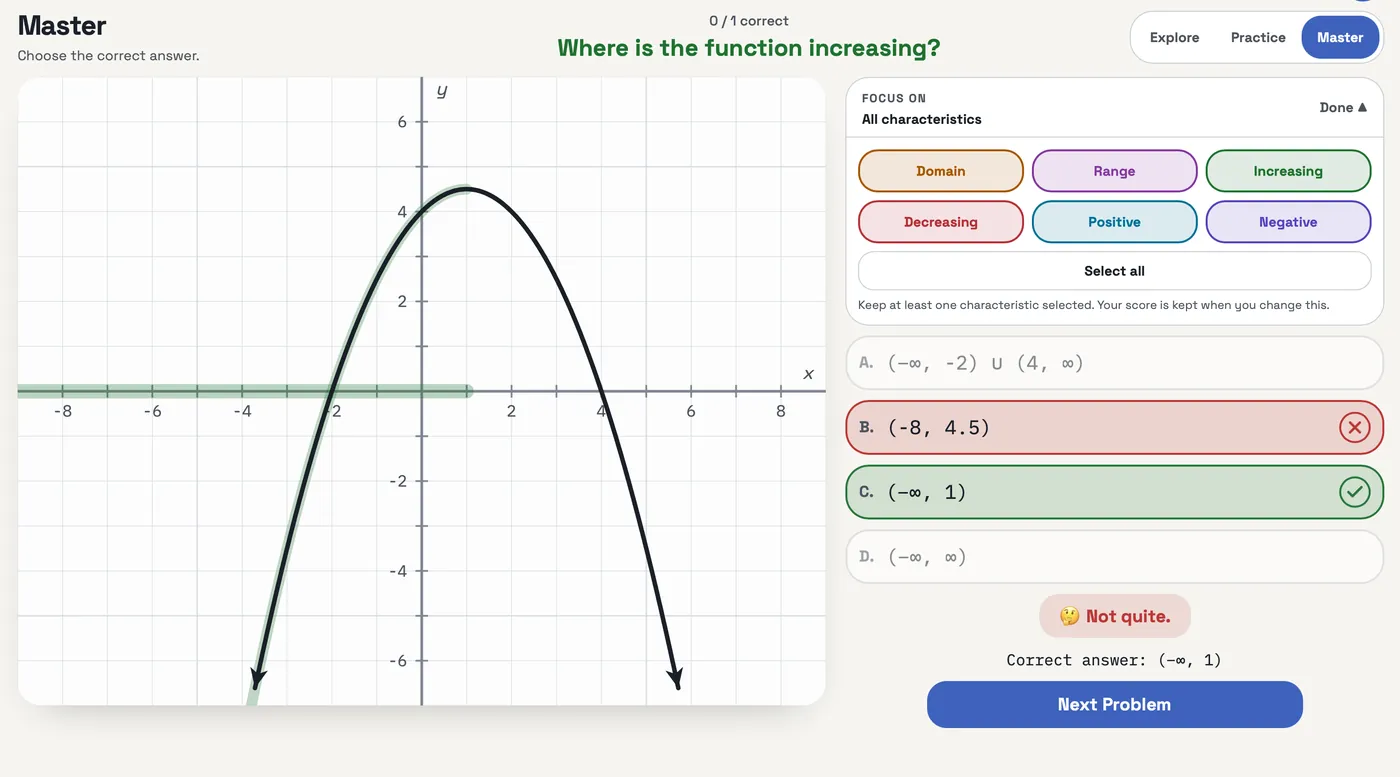
Multiple-choice questions with answers that look alike, the way they do on a test. A wrong pick shows the correct answer and highlights it on the graph.

  • Instant feedback with the correct interval
  • Running score for each student
  • With the Full Edition, questions span all 15 graphs
Master mode: the question asks where a downward parabola is increasing; the correct answer, negative infinity to 1, is marked and highlighted green on the graph.

What lights up

Six ideas students usually memorize. Here they see them.

Every trace colors the axis for the feature being practiced, so the interval notation matches something students just did with their own finger.

Domain

[−6, 5]

Every x-value the graph covers, from its left end to its right end.

Range

[−4, 4]

Every output the graph reaches, from its lowest point to its highest.

Increasing

(−6, −3) ∪ (1, 5)

Where the graph rises as you move left to right.

Decreasing

(−3, 1)

Where the graph falls as you move left to right.

Positive

[−6, −1) ∪ (3, 5]

The x-values where the graph sits above the x-axis.

Negative

(−1, 3)

The x-values where the graph dips below the x-axis.

The graph library

15 graphs, from a line to exponentials.

Each graph is chosen to practice a different kind of interval: closed and open endpoints, rays, pieces, and asymptotes. The free version includes the Line. The Full Edition unlocks all 15.

  • Line

    Free

    Arrows both ways

  • Parabola

    Arrows both ways

  • Down Parabola

    Arrows both ways

  • Absolute Value

    Arrows both ways

  • Zigzag [ ]

    Closed endpoints

  • Square Root

    Closed start, arrow right

  • Segment [ ]

    Closed endpoints

  • Open Arc ( )

    Open endpoints

  • Half-Open [ )

    One closed, one open

  • Ray ( →

    Open start, arrow right

  • Ray [ →

    Closed start, arrow right

  • Piecewise [ ]

    Two pieces, closed endpoints

  • Exponential Growth

    Horizontal asymptote

  • Exponential Decay

    Horizontal asymptote

  • Exponential Reflected

    Horizontal asymptote

How it works in class

One code on the board. The whole class is in.

  1. Sign in and start a session

    Sign in with Google, pick your class length (30 to 60 minutes), and generate a class code.

  2. Students scan and join

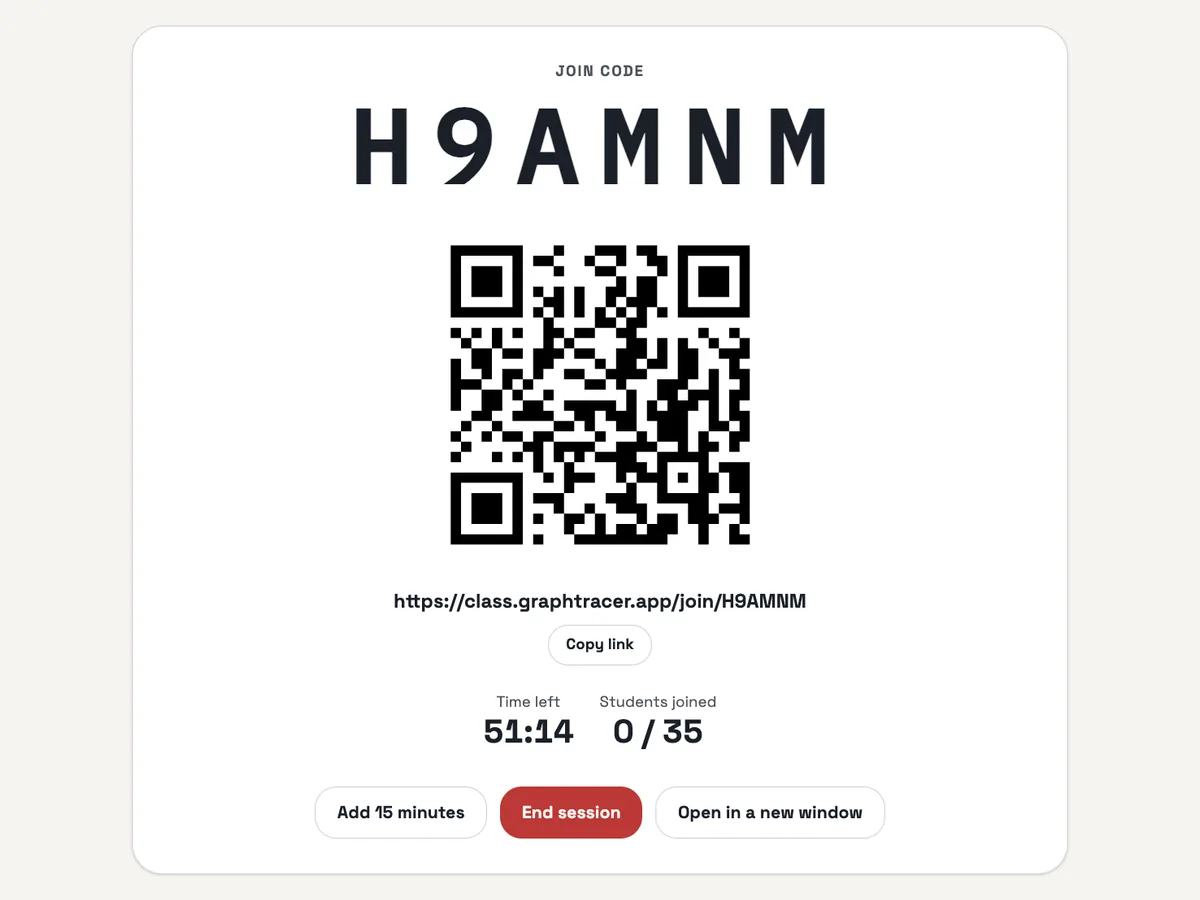
    Put the QR code or six-letter join code on your screen. Up to 35 students join from their own devices, with no accounts or sign-ups.

  3. See how the class did

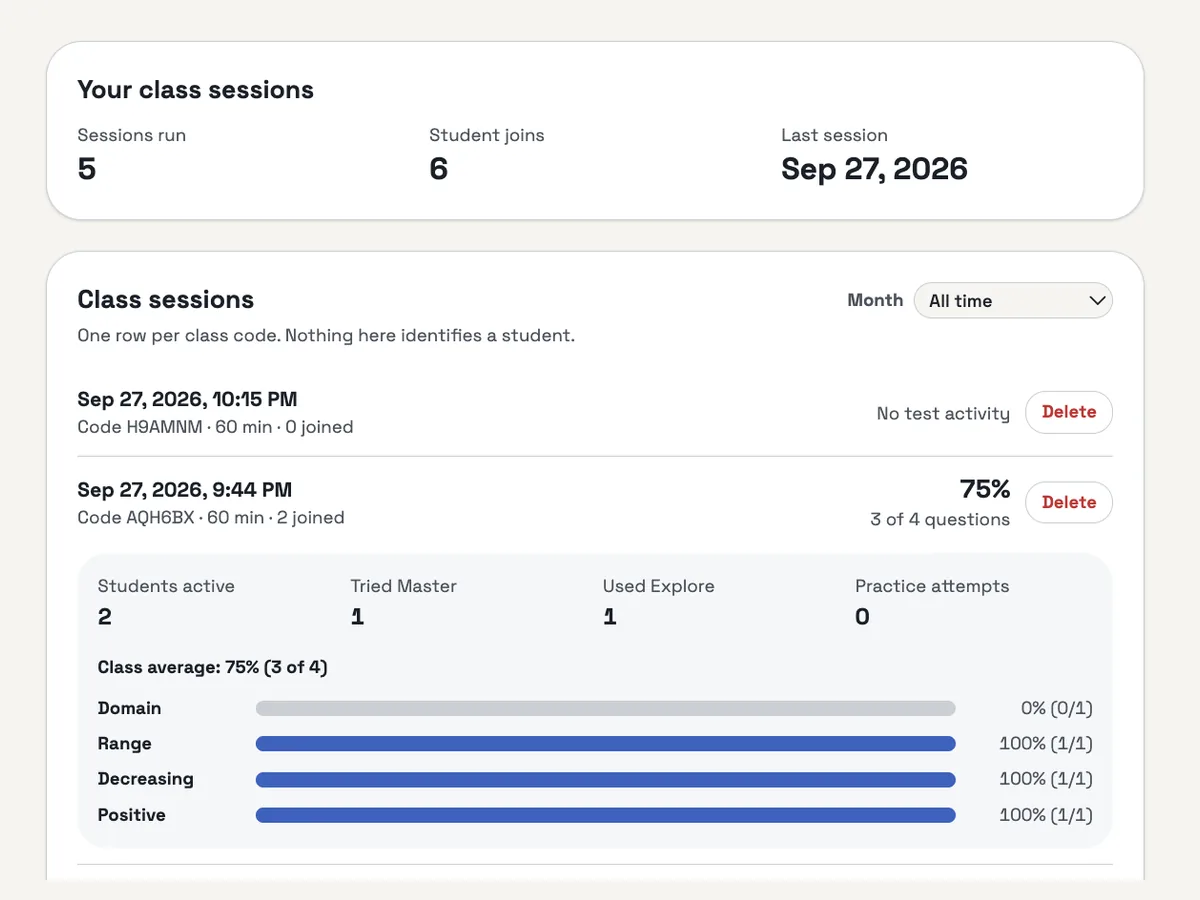
    When more than one student takes part, you get the class average and results for each characteristic. Nothing identifies a student.

Class session screen with a large six-letter join code, a QR code, the join link, time left, and students joined out of 35.
The join screen: code, QR code, timer, and a live count of students joined.
Class sessions report showing sessions run, a class average of 75 percent, and results for domain, range, decreasing, and positive.
Class results: one row per session, with the class average and each characteristic.

Measure growth: run a session at the start of a unit and again at the end, then compare the class results.

Pricing

Try one graph free. Upgrade anytime for all 15.

50% off for the first 50 customers. Use code FIRST50 on the annual Full Edition, through May 2027.

Free try

Start here

$0one teacher · no card needed

  • One graph: the Line
  • Explore, Practice, and Master modes
  • Real class sessions with a join code for up to 35 students
  • Teachers sign in with any Google account; students never sign in

From teachers

What teachers are saying

Built for classrooms

Student privacy by design.

Graph Tracer collects only what it needs to run your class. Details are in our Privacy Policy.

  • No student accountsStudents join through anonymous links that expire at the end of class.
  • No student PIIGraph Tracer doesn't capture personally identifiable student information.
  • Aggregate results onlySession scores are reported to you in aggregate, and only when more than one student takes part.
  • Never sold, never adsWe don't sell personal information or use student information for advertising.
  • Not used to train AIStudent information and class traces aren't used to train general-purpose AI models.
  • Payments by StripeCard details stay with Stripe. We never store full card numbers.

FAQ

Questions teachers ask

Is Graph Tracer free?

Yes, you can try it free. Sign in with a Google account to use one linear graph, for one teacher and in-class use with up to 35 students. No card is required. The Full Edition unlocks all 15 graphs for $39.99 per year.

What's included in the free version?

One graph, the Line, with all three modes: Explore, Practice, and Master. You can run class sessions with a join code for up to 35 students. The Full Edition adds the other 14 graphs, and students can test themselves across all graphs and characteristics.

How do students join?

Start a class session and show the QR code or six-letter join code on your screen. Students scan it or type it in. They don't need accounts, and the link expires when the session ends.

Can I see how my class did?

Yes. When more than one student takes part in a session, you see the class average and results for each characteristic. Results are only in aggregate, so nothing identifies a student. Many teachers run a session at the start of a unit and again at the end.

Do students need accounts?

No. Students join a class session through an anonymous link that expires at the end of class. Graph Tracer does not capture personally identifiable student information.

How do I log in?

Go to class.graphtracer.app and sign in with Google. Bookmark that address so you can get back to your classes quickly.

I paid. Why don't I see all 15 graphs?

Access is given to the Google account whose email you used at checkout. Sign in with that same Google address. If it still doesn't unlock, email support@graphtracer.app.

Can other teachers at my school share my subscription?

No. The Full Edition is licensed to one teacher for in-class use with up to 35 students. It is not a school-wide or district license, so a second teacher needs a second subscription.

How do I cancel?

Cancel anytime in the Stripe customer portal or by emailing support@graphtracer.app. Cancellation takes effect at the end of your current paid year, and you keep access until then.

Put a graph in your students' hands.

Start with one linear graph free. Upgrade to all 15 whenever you're ready.

Ready for your class? Teacher sign-in with Google · Returning teacher? Log in at class.graphtracer.app